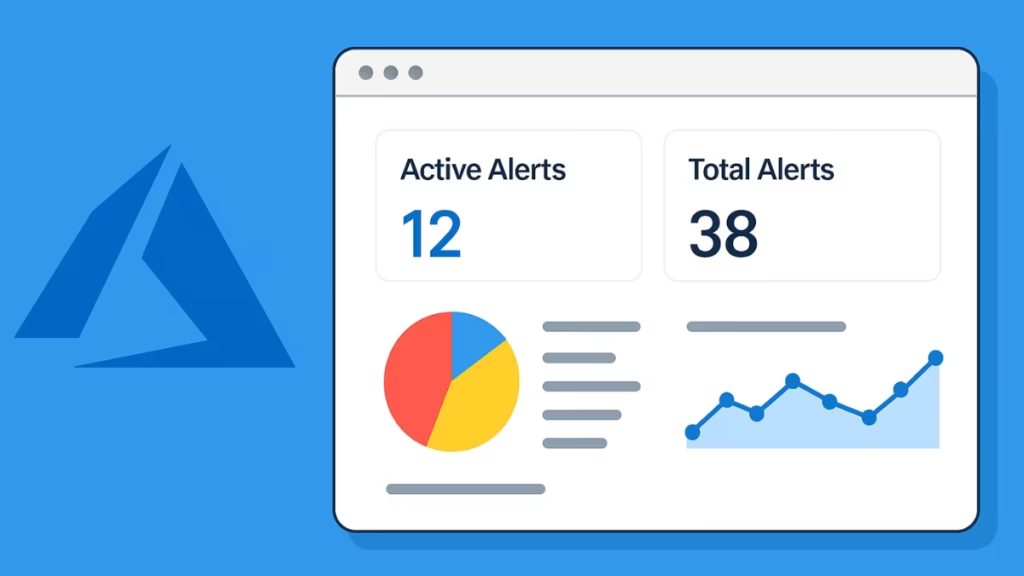
If you want your Azure dashboard to display the number of active alerts or the total alerts fired in a specific time range, you won’t find it directly inside Application Insights. Alerts are managed at the Azure Monitor level and stored in Log Analytics, so you need to query them from there.

Why You Can’t Get Alerts Directly from App Insights
Application Insights is designed to track telemetry like requests, dependencies, and traces. Active and historical alert information is written to the AlertsManagementResources table (or AzureDiagnostics) in the linked Log Analytics workspace.
That’s where we’ll query the data to build the dashboard widget.
Step 1: Open Azure Monitor Logs
- Go to the Azure Portal.
- Navigate to Azure Monitor → Logs.
- Select the Log Analytics workspace linked to your Application Insights resource.
Step 2: Run KQL Queries
You can run different queries depending on whether you want active alerts or alerts over a time range.
2.1. Active Alerts Right Now
AlertsManagementResources
| where tostring(properties.essentials.alertState) == "Fired"
| summarize ActiveAlerts = count()
This shows the current count of alerts still in the Fired state.
2.2. Alerts Fired in the Last 7 Days
AlertsManagementResources
| where todatetime(properties.essentials.startDateTime) between (ago(7d) .. now())
| where tostring(properties.essentials.alertState) == "Fired"
| summarize TotalFired = count()
This counts all alerts triggered within the past 7 days.
(Tip: Adjust 7d to 30d, 24h, etc., for your desired time window.)
Step 3: Visualize Results
- After running the query, choose Chart or Number visualization.
- Use Number if you just want the raw count.
- Use Time Chart to see alert trends over time.
- Verify the output looks correct.
Step 4: Pin to Dashboard
- Click Pin to dashboard on the top menu.
- Select your target dashboard.
- Go back to your Azure dashboard – you’ll now see the active alert count (or total fired count) as a live widget.
Advanced: Combine Active and Total Counts
If you want both active alerts now and total alerts in a time range in a single tile:
union
(AlertsManagementResources
| where tostring(properties.essentials.alertState) == "Fired"
| summarize Metric="ActiveAlerts", Count=count()),
(AlertsManagementResources
| where todatetime(properties.essentials.startDateTime) between (ago(7d) .. now())
| where tostring(properties.essentials.alertState) == "Fired"
| summarize Metric="TotalFired(7d)", Count=count())
This produces a table with two rows: one for current active alerts and one for total fired in the last 7 days.
Alternative: Pin Alerts Blade Directly
If you don’t want to run KQL queries:
- Go to Azure Monitor → Alerts.
- Filter for Active alerts.
- At the top, the active alert count is displayed.
- Click Pin to Dashboard to add it directly.
This is the fastest way if you only need the current active count.
Quick Fixes for Common Errors
Q. No AlertsManagementResources table found?
Make sure your Log Analytics workspace is linked to your App Insights resource.
Go to App Insights → Diagnostic settings and confirm logs are sent to Log Analytics.
Q. Query returns no data?
Ensure that alerts are firing. If not, try simulating a test alert to populate the table.
Q. Slow queries or blank charts?
Limit the time range (e.g., 7d or 24h) instead of querying months of history.
Quick Tips for Dashboard Setup
- Separate by severity:
- Add a filter in the query:
| where tostring(properties.essentials.severity) == "Sev2"to track only critical alerts.
- Create multiple tiles:
- One tile for Active Critical Alerts, one for Total Alerts in Last 7 Days, and another for Resolved Alerts.
- Keep dashboards lightweight:
- Use simple counts where possible to avoid performance overhead.
- Automate reporting:
- If you need regular reports, connect the queries to Workbooks or export via Azure Monitor Alerts API.
You can’t directly get alert counts from Application Insights, but by querying Log Analytics (AlertsManagementResources) you can create a widget that shows both real-time active alerts and historical alert trends.
For quick setups, just pin the Active Alerts blade directly to your dashboard. For advanced scenarios, use KQL queries and customize visualizations. With these methods, your Azure dashboard becomes a true single-pane health view of your environment.


![Fix: Azure VM Not Accessible After Switching to Standard SKU Public IP [Complete Guide]](https://winfix.fdaytalk.com/wp-content/uploads/2025/10/frf45-2025-10-08T143750.244-150x150.avif)